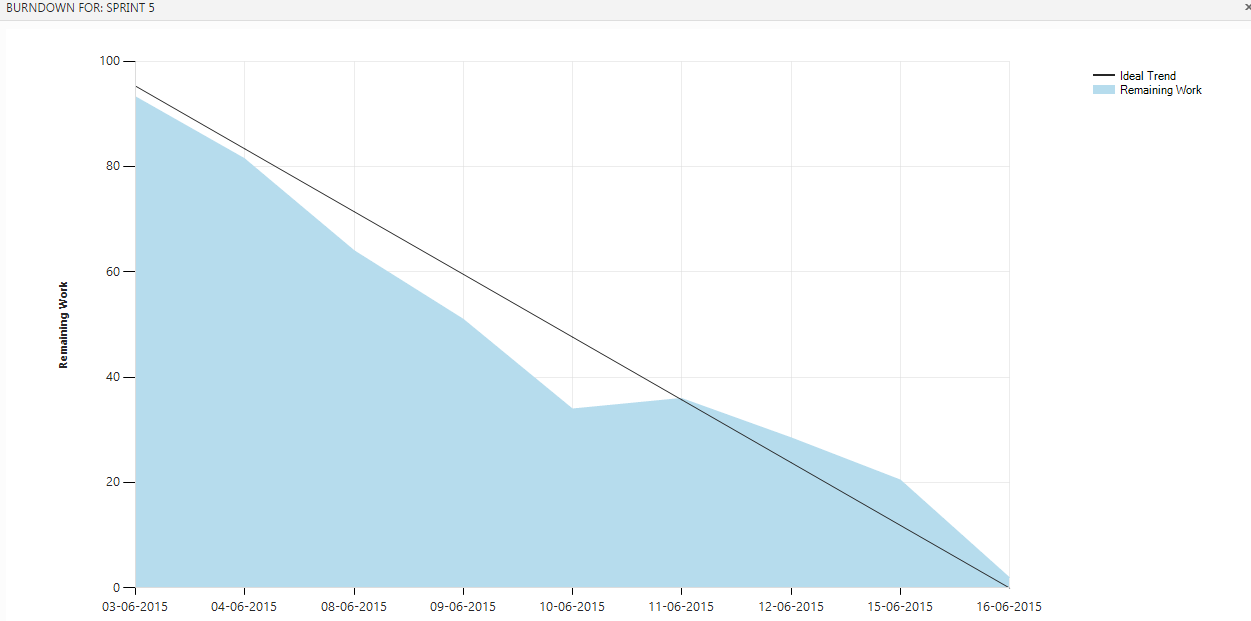
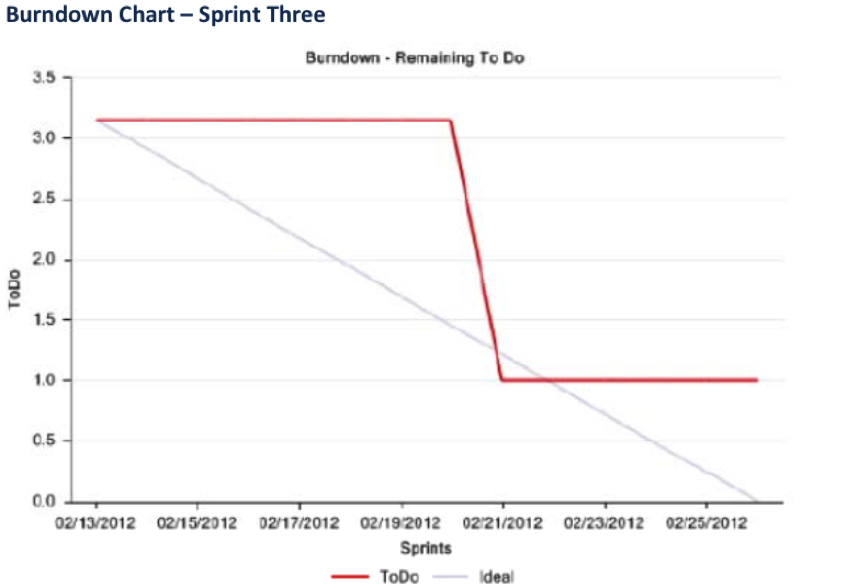
We are using TFS2013 Update 4 with the latest scrum template. And we have been going back and forth on how to read the burndown chart on task board.
Especially regarding the last day of the sprint. This day is where our demo and retro are, and thus effectively we do not get any work done. But still the ideal trend is suggesting that we actually have full day of work to do.
If the ideal trend is showing what the remaining work should be at the start of the day in the graph, then it make sense. Otherwise could someone please explain how to read it, or at least point me in the direction of some documentation about this graph.
An acknowledgement would also be much appreciated.
Edit:

