6

I often have the need to achieve a specified goal (e.g. deliver a piece of software functionality). At the start of the work I identify the goal and can list some tasks needed to bring about the desired outcome. For each of the identified tasks, I may be able to break these down into sub tasks. Usually though, tasks (at different levels of detail) needed to be undertaken to achieve the goal are discovered as work progresses. So for example, some research (a task in itself) may be needed to determine the best approach for a particular part of the work before the actual work tasks can be identified.

In the most basic form, I can represent the hierarchy of composed tasks using, say, an indented list, though there are difficulties in also representing arbitrary ordering constraints. Alternatively, I can use Microsoft Project to show the task hierarchy and the ordering of tasks.

However, both of these approaches are quite 'listy'. I was wondering what methods exist that would allow me to represent the tasks and their relationships on a diagram, perhaps with nodes shown as tasks, and relationships (e.g. composition, ordering) shown as lines.

8
  • 1
    Good question, but reads a bit too much like a shopping list question. Might want to reword slightly to avoid asking for a list of things.
    – Sarov
    Commented Apr 3, 2017 at 13:25
  • Thanks @Sarov, I've removed a question. Hopefully it's a bit more focused.
    – fractor
    Commented Apr 3, 2017 at 13:55
  • 1
    The phrase "I was wondering what tools exist" makes it a shopping list question. Commented Apr 5, 2017 at 12:13
  • 1
    Ah, yes I see. As this is actually the question I want an answer to, I guess this is not the right forum for this. However, I see I risk being penalized if I delete an answered question.
    – fractor
    Commented Apr 5, 2017 at 20:39
  • 1
    Since you tagged your question with "agile," I have to chime in here. If your dependency graph is that complex, you're doing agile planning wrong. You may want to rethink your methodology and granularity, and let the team manage dependencies within each iteration.
    – Todd A. Jacobs
    Commented Apr 12, 2017 at 7:01

5 Answers 5

6

TL;DR

Respect the time box, and do "just-in-time planning." Don't do so much up-front decomposition, and rely instead on iterative delivery to provide you with an emergent design.

Analysis

From an agile planning viewpoint, you're doing something fundamentally wrong if your backlog requires complex dependency graphing. In particular, you're either:

  1. not leveraging the concept of thin, vertical slices of functionality to deliver incrementally; or
  2. you're trying to do too much decomposition up front.

Agile frameworks aren't designed for work that requires heavy up-front design and specification. They're meant for incremental, iterative, and emergent designs. Leverage that. You must embrace incremental, iterative delivery and emergent design if you want to be successful with an agile methodology.

Recommendations

Project Methodology

If you're the project manager, you need to refine your methodology. Specifically, you should rework your product backlog so that you aren't trying to do so much up-front decomposition that your entire backlog is filled with tasks.

Ideally, your backlog will be filled with cohesive epics and themes, with only work for the next few iterations decomposed into relatively independent user stories. The user stories should follow the INVEST mnemonic, so that you don't have a complex dependency graph to deal with.

You should only be defining tasks for the current iteration. While tasks can certainly have dependencies, a feature that has been properly scoped for a single iteration should not have so many tasks that a complex dependency graph is necessary.

Sometimes, you may need a time-boxed story spike to help refine, decompose, or plan the work ahead, but that work is not expected to fit into the current iteration! If you uncover new or unplanned tasks during an iteration, schedule the work for a future iteration whenever possible. Otherwise, you may need to halt the current iteration and replan. That's how iterative methodologies fundamentally work!

Dependency Graphing

There are lots of methodologies for dependency graphing. One of the more useful ones in the software development space is the Mikado Method. It helps the team or developer work backwards from the goal to the current state, identifying dependencies and refactorings through a directed graph. Ultimately, though, the graph is a means to an end, and not a goal in itself.

If you aren't doing software, other techniques may help you resolve dependencies and order your graph. Entire books are filled with the theory and practice of how to generate such graphs, so an exhaustive list would be out of scope.

In agile methodologies, though, the work scheduled for the iteration rarely needs the level of graphing you seem to be asking for. While it's very useful for defining the critical path on refactorings, unscheduled work is too high-level to create such a graph, while scheduled work should be too obvious to need one.
2
  • Thanks, that's very interesting, especially the Mikado Method. I used the agile tag because the way I tend to work is iterative, leaving decisions to the point at which they need to be made. I don't think I suggested a big upfront decomposition of tasks in my original post. I was interested in the opposite really. An ability to incrementally plan just enough to put the current work in context, and to be able to modify the plan as work progresses.
    – fractor
    Commented Apr 12, 2017 at 10:39
  • Of all these, the Mikado method seems most appropriate for software. " the graph is a means to an end, and not a goal in itself" - this is true of all planning techniques, in my opinion! Commented Jan 5, 2018 at 19:13
0

You could pretty much build it by integrating Excel / MS Project, SharePoint, and PowerPoint. Though it is painful to build, it's worth it as it could be customized as per your requirement.

However, it appears that there is one such tool that could bring a visual effect for the task management.

  1. http://itsm360.net/task-management/ Right from assignment to taking to closure, you could visualize the entire sequence. You could find more details about this product on their website.
1
  • From a first glance at the website, this looks like another card and list-based approach. Not the sort of thing I was thinking of. Thanks anyway.
    – fractor
    Commented Apr 5, 2017 at 17:30
0

There are two classical approaches to visualize requirements/tasks and their dependencies.

  1. Predence Diagram Method

  2. Gantt Chart

I am pretty sure you will find some tools for you favorite technique.

4
  • I think Predence Diagram Method is possibly the closest to what I'm thinking of, thanks.
    – fractor
    Commented Apr 12, 2017 at 10:27
  • Well, out of these two anyway. The Mikado Method mentioned by @CodeGnome looks even more like it.
    – fractor
    Commented Apr 12, 2017 at 10:35
  • @factor, thats what I thought. If you found this answer useful don't forget to upvote it or even accept the answer. Also worth to read meta.stackexchange.com/questions/5234/… Commented Apr 12, 2017 at 10:36
  • @factor, I don't know much about the Mikado Method but for what I know it's originally not used to modelling project requirements. Commented Apr 12, 2017 at 10:40
0

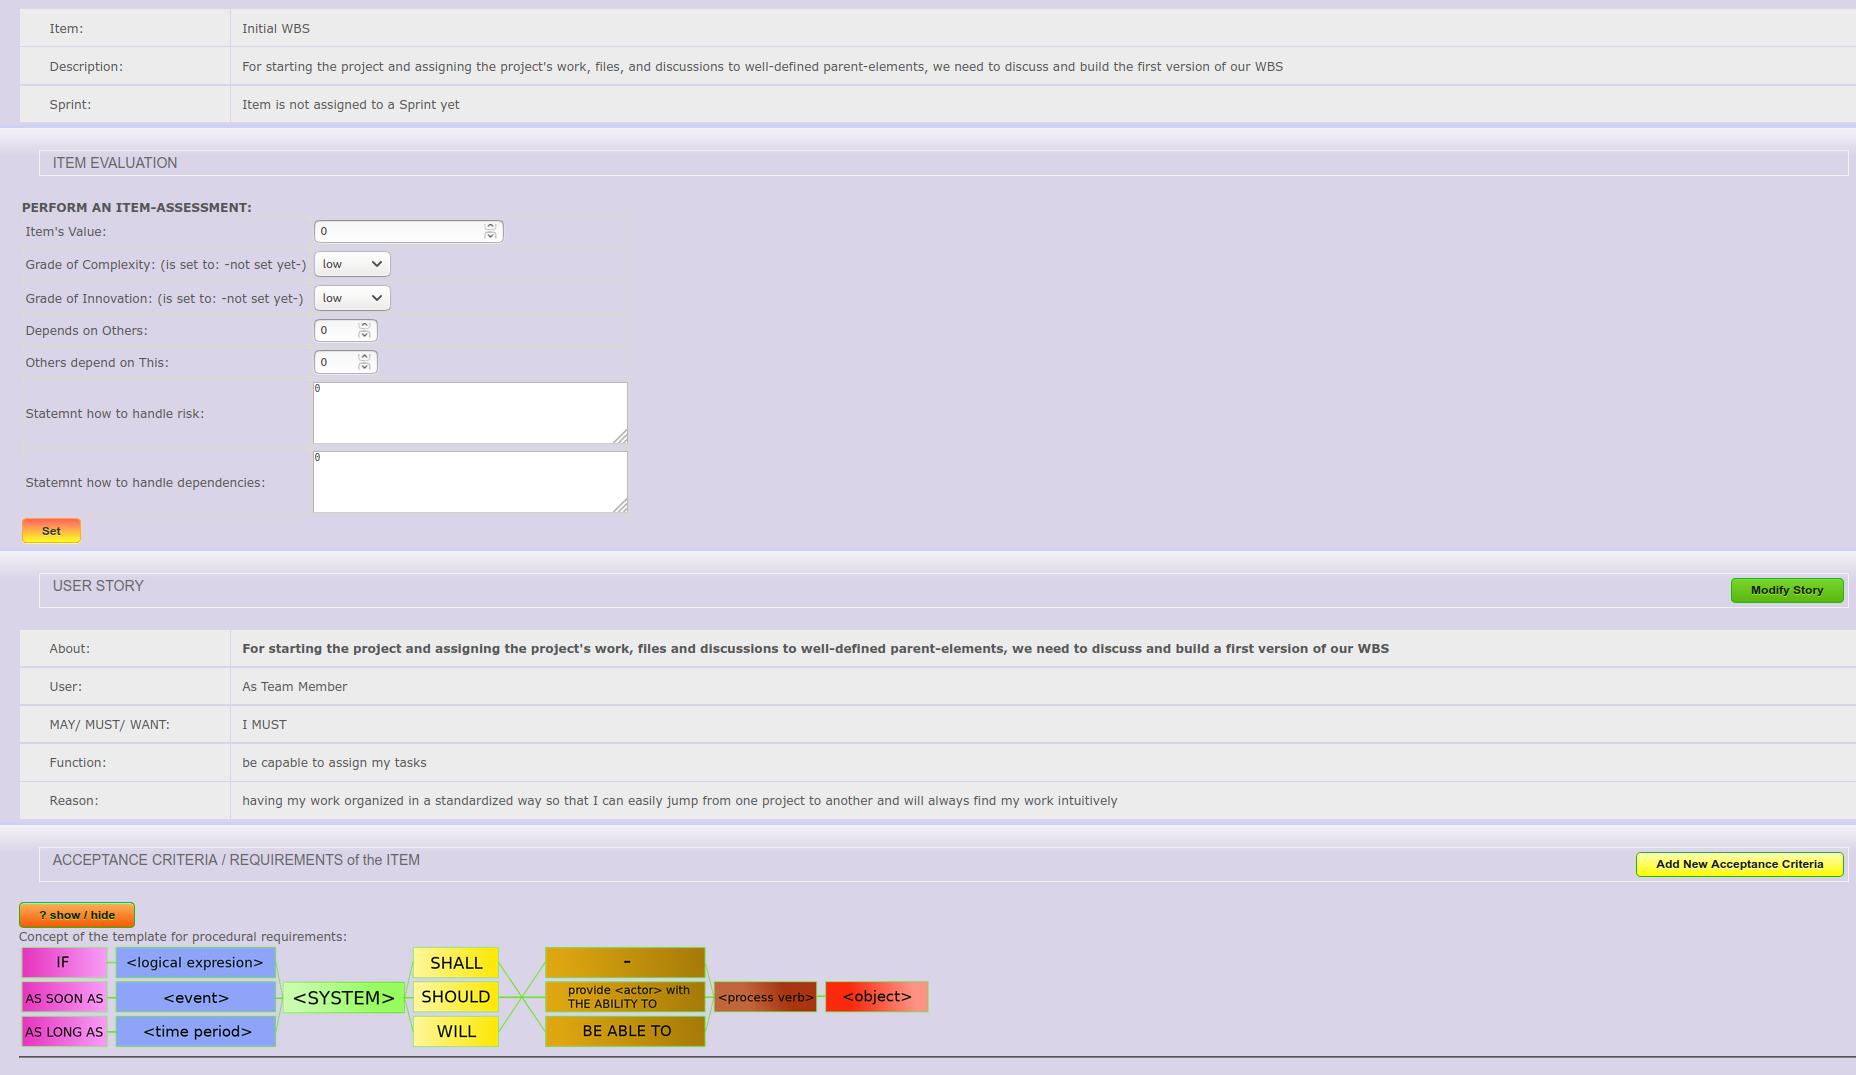
within my remote Scrum application I have integrated very simple assessments - for the ProductBacklogItems as well as for the tasks: A) the risk is a combination of: 1.) complexity: value[1,2,3] 2.) innovation: value[1,2,3] B) dependencies are in both directions: 1.) how much do others depend on this task: value[1,2,3] 2.) how much does this task depend on others: value[1,2,3] ... plus: in case you do have higher values given (one 3 or two 2s): add some text into the textarea how you want to handle this...

you can visualize this with a 9x9 grid and make the colors green-yellow-red (like a traffic light).

I made the application (the CYBR-SUITE (CYSU) remote Scrum solution) available via Sourceforge at the moment: https://sourceforge.net/projects/cybr/

It's running on docker via docker-compose - "all" you need is a VPS with 2GB RAM and a Linux kernel (plus docker & docker-compose, of course.. check the README.md for a step-by-step installation ..)

Img below is a screenshot showing the ProductBacklogItem's assessment/evaluation - but it's very much the same for the tasks.. this image is of the Item since I as the PO have not added the DevTeams tasks on it - but the tasks do have the same fields for the assessment/evaluation of risk and dependencies

0

I just gotta say this: "Microsoft Project®" is king of that hill – and for very good reasons." It is excellent at managing inter-task dependencies. The product was born out of a set of Microsoft Excel macros that Microsoft Corporation was using for its own purposes ... and, it shows. I've never found any software product in the open-source world that came anywhere close to it. Buy a copy and learn it very well.

Your Answer

By clicking “Post Your Answer”, you agree to our terms of service and acknowledge you have read our privacy policy.

Not the answer you're looking for? Browse other questions tagged or ask your own question.