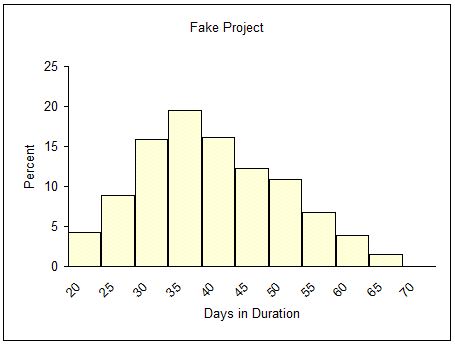
I think this is based on the project Ogive curve (not to be confused with the Earned Value S Curve of a Performance Measurement Baseline) and I think it is based on "finish," not "start." I created a fake project that is estimated to finish between 20 days (best case), 35 days (most likely case), and 70 days (worst case). Running a simulation with over 750 observations, this is the result: ![enter image description here][1]
This shows that you have a little less than 20% chance of finishing this project between 35 and 40 days, and a little less than 50% cumulatively at 35 to 40 days or less.
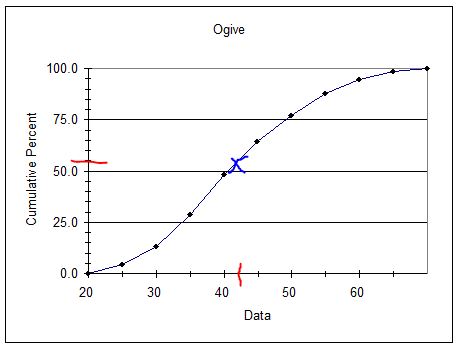
The cumulative histograph is here:
![enter image description here][2]
The red line above the 50% mark on the Y axis is approximately 60% cumulative. The blue X represents where that 60% mark intercepts the Ogive curve. The red line on the X axis represents the number of days at the 60% mark, approximately 42 or 43 days in duration.
Therefore, 42 or 43 days of duration would be the planning value that represents 60% early and 40% late on the plan curve.
This is my opinion only of what your question could mean. I'd take Marv's suggestion and go back and get this clarified. This is the only thing I can think of that makes any sense in project management. [1]: https://i.sstatic.net/wkxTv.jpg [2]: https://i.sstatic.net/7l43K.jpg