I find it hard to visualise projects across the years on a Gantt chart, especially when there are seasonal tasks repeating.
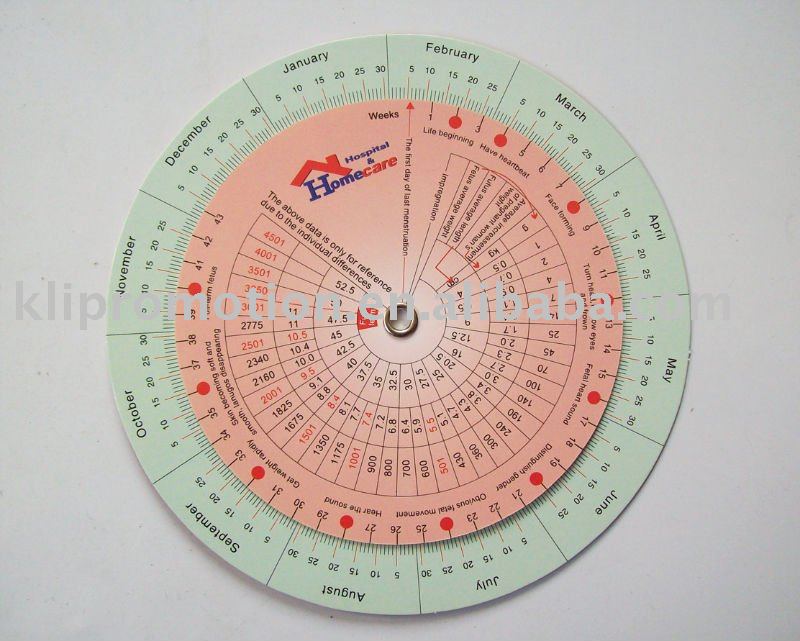
It would be nice to have a tool that looks like a pregnancy calculator disc, that emphasises the repeating of seasons, etc:

Is there any formal type of diagram or tool that does that?