5

Useful charts for a Kanban system shows how to read a Kanban cumulative flow chart. I am wondering what patterns stand out on a Scrum cumulative flow burnup? I've seen two patterns frequently: the hockey stick and the bottleneck. What other problem behavior can show up in a flow burnup, and what can be done to correct it? Also, what intermediate states may be fruitfully charted other than In Development and In Testing?
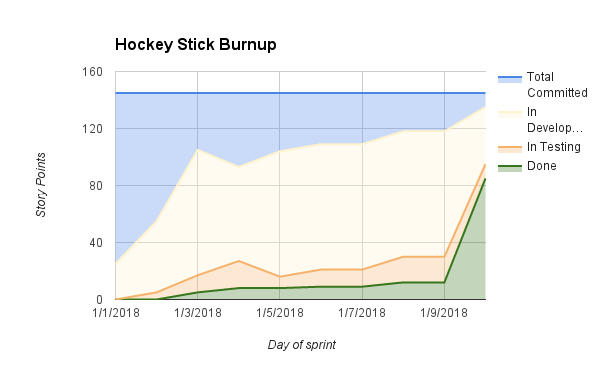
Hockey Stick Burnup

This example uses mock data; see How can we avoid finishing all stories on the last day of a sprint? for a real-life example and some great discussion.
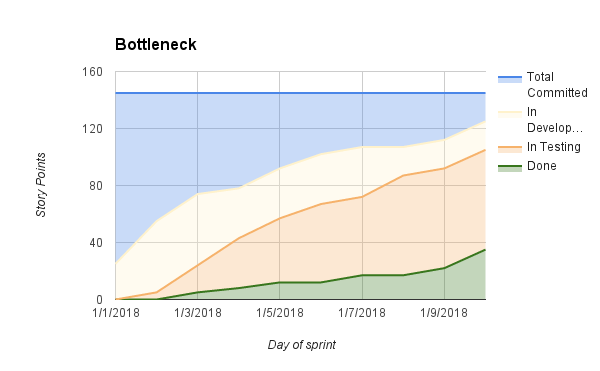
Scrum Cumulative Flow Burnup showing testing bottleneck

See Best strategies for dealing with integration testing bottlenecks? and How to better balance resources in a cross-functional agile team? for some discussion relative to bottlenecks.
1
  • The answers to date are very helpful interpretations of the patterns in the question. I am especially interested in any new patterns anyone has seen, which are not already documented here, which may help diagnose problems in a Scrum team.
    – Joel
    Commented Jul 28, 2015 at 21:33

3 Answers 3

2

I am wondering what patterns stand out on a Scrum cumulative flow burnup?

  • Too much work in progress in development,
  • slow testing (automate?)
  • a very long lead time, and
  • a not changing backlog, which is strange. A backlog should change after a while because the team and the product manager learns more about the product.

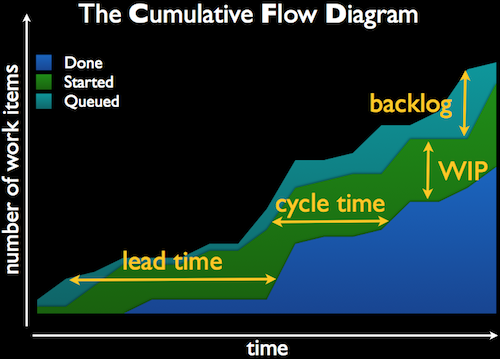
This graph may help you read your CFDs (source):

CFD

What other problem behavior can show up in a flow burnup, and what can be done to correct it?

Limit the work in progress in development. Testing might be a bottleneck, so try not to overload testing. Either limit work in development, or increase testing (hire, convert etc.)

Also, what intermediate states may be fruitfully charted other than In Development and In Testing?

I think that enough for a starter CFD, because you see all your problems. As an additional metric, I recommend to check lead time (how much time does it takes to get something from the first keystroke to production).

2
  • In these examples, the backlog refers to a Sprint backlog. The scope of a Sprint backlog should, as I understand it, remain constant during a sprint unless a team chooses to reach out and add scope.
    – Joel
    Commented Jul 16, 2015 at 19:31
  • That makes sense (that's one reason why I don't like Scrum). In this case try working on 1 maximum two user stories until you are done with them - like really; be in production. You need about 7 days to deliver 70 points, and that's too much. Try to move the "hockey stick" to the left as much as possible (you'll have multiple ones in this case, but less steep).
    – Zsolt
    Commented Jul 16, 2015 at 19:40
0

The 'hockey stick' is a very common problem. I call it the 'cliff edge' when using a burndown chart.

The other states that you might consider including in the chart will depend on the way you do your development. Some states I have seen used are:

  • Product Owner Review
  • UAT
  • Blocked
0

Sprint has a very common trap, that leads directly two both of these chart types. The trap is lack of Work in Progress limits.

Day 1 of a two week Sprint and there are five developers on the team. Each developer picks up 1 story, so WIP is 5 on day one. Say it takes an average of 5 days to complete the work on a user story. This means on day six of the 10 day sprint 5 stories complete and go to testing. QA, which is only two people, is slammed with a bunch of work.

To add to this, most likely the developers are not doing Test or Behavior Driven Development and as soon as they finish their first story they go grab another one. So even if QA finishes testing, two things usually happen. 1- They find bugs that have to go back to the Devs and 2- There are more stories to be tested which come in on the last day of the sprint.

By implementing WIP limits (and I also recommend aggressive story slicing, to make stories as small as possible) you force developers to work on fewer stories (story swarming).

With a two week sprint, you want a total cycle time of 2-3 days from start to "done". WIP limits, smaller stories, up front testing (TDD, BDD) will help you do this and will tackle both of those scary Cumulative Flow Diagrams.

Your Answer

By clicking “Post Your Answer”, you agree to our terms of service and acknowledge you have read our privacy policy.

Not the answer you're looking for? Browse other questions tagged or ask your own question.