If all you're changing are task durations (i.e. no different tasks, changed predecessors, successors, etc), you could use the DurationX columns (Duration1, Duration2, etc) to represent the other durations.
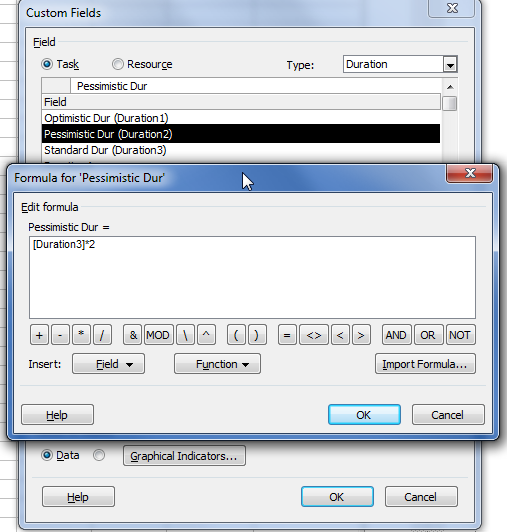
For example, in the screenshot below, I've set Duration1 to "Optimistic Duration" and configured the field to be 1/2 of the "Standard Duration" (Duration3). Duration2 = "Pessimistic Duration" and is configured to be 2x the "Standard Duration". The second screenshot shows how Duration1 and Duration2 are automatically updated (i.e. blue background) when Duration3 is updated.
Optimistic, Standard, and Pessimistic Duration columns

The rub is that the Duration3 field is not used in the Gantt chart -- you'll need to copy-and-paste the duration values (from Duration1, 2, or 3) into the "Duration" field to have the Gantt chart display those specific values. Project (at least as of 2007) does not have a way to show multiple durations for a single task.
Setting the Formula for "Pessimistic Dur" as an example:

Here's what it looks like (using Project 2007) when you update the "Standard Dur" field -- the Optimistic and Pessimistic fields are re-calculated automatically.

Creating a script to update Duration values for all tasks would be trivial to write.


