1

I am trying to measure the cycle time of my team. The problem is that the issues (tasks or stories) have very different sizes. Sometimes someone just creates a task like: "Create a backend api", that doesn't deliver value for the final customer and is very small. And sometimes the Product Owner creates tasks like "Implement anti fraud system" which are very large.

How should we measure the cycle time? One convention that we have been using is to only measure stories' cycle time, not tasks' nor subtasks'.

How should this be done?
5
  • Story sizes will vary, by its very nature. How do you plan to use cycle time? Commented Mar 27, 2018 at 13:10
  • I am planning to use it as a metric to improve the development process. Commented Mar 27, 2018 at 13:17
  • what is a cycle?
    – Alexey R.
    Commented Mar 27, 2018 at 13:17
  • 1
    That the point. Actually it's a time delta between a Story (not a task) to move from in progress to done (deployed in production). Commented Mar 27, 2018 at 13:20
  • @AlexeyR. Cycle time is the time it takes from when your task/story/ticket/whatever begins the process (typically begin development) to when it ends (typically when it satisfies the Definition of Done).
    – Sarov
    Commented Mar 27, 2018 at 13:20

2 Answers 2

2

The simple answer: you want to measure cycle time against your backlog items, not the tasks under those. The goal is to measure how long it is taking to deliver a unit of work. Tasks are just things you do, not units of work being delivered.

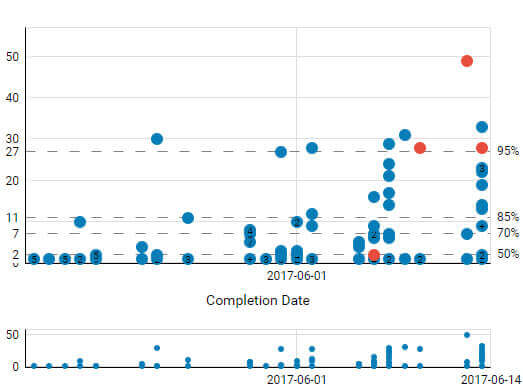
Your cycle time will vary by the size of the item, that isn't a problem. You want to look at your cycle time on a scatter plot like this:

enter image description here

(Image borrowed from https://kanbanize.com/kanban-resources/kanban-analytics/cycle-time-scatter-plot/)

You'll want to look for patterns in the outliers. Why do the long backlog items take longer? Is it because they are vague and you discover problems that you never expected once you dig in? If so, maybe that means you need to get a little more specific with your backlog refinement. Maybe you notice that many of the long ones are changes to a certain application. What can you do to correct that?

So, the fact that they are very different sizes shouldn't matter much.

2
  • Just for clarity, the scale on the left is the cycle time of that item. The percentages are what percent of all items are done at or under that amount of time. Each dot is a backlog item plotted at its cycle time.
    – Daniel
    Commented Mar 27, 2018 at 18:21
  • Another useful visualization of cycle times is a distribution curve
    – RubberDuck
    Commented Apr 27, 2018 at 9:52
1

The first thing you need to ask yourself is for what reason your Team is tracking cycle time. If you're not currently tracking cycle time for tasks/subtasks, and you don't have any problems with doing so, then I see no reason for you start now.

If you do need to track them for whatever reason, then I suggest using a rolling average - you take the average of all recent tasks/subtasks finished in the past defined time frame (possibly weighting more recent results more heavily). With a long enough time frame, the opposing outliers should more or less balance each other out.

One final note: The Product Owner should not be creating Tasks. That is the purview of the Development Team solely. Rather than a Task for "Implement anti fraud system", what should have been made was a Story for "Avoid damage from fraud".

Your Answer

By clicking “Post Your Answer”, you agree to our terms of service and acknowledge you have read our privacy policy.

Not the answer you're looking for? Browse other questions tagged or ask your own question.