Yes. You can create an Excel Visual Report.
In the “Report” tab, select “Visual Reports”. In the dialog, select any Excel report from the “Assignment usage” tab (the “Baseline Work Report” worked for me). In the “Select level of usage data to include in the report” combo, choose the time-phased detail you need; unless you need a daily detail (e.g. hours per resource per day), you can leave the default “Weeks” option selected.
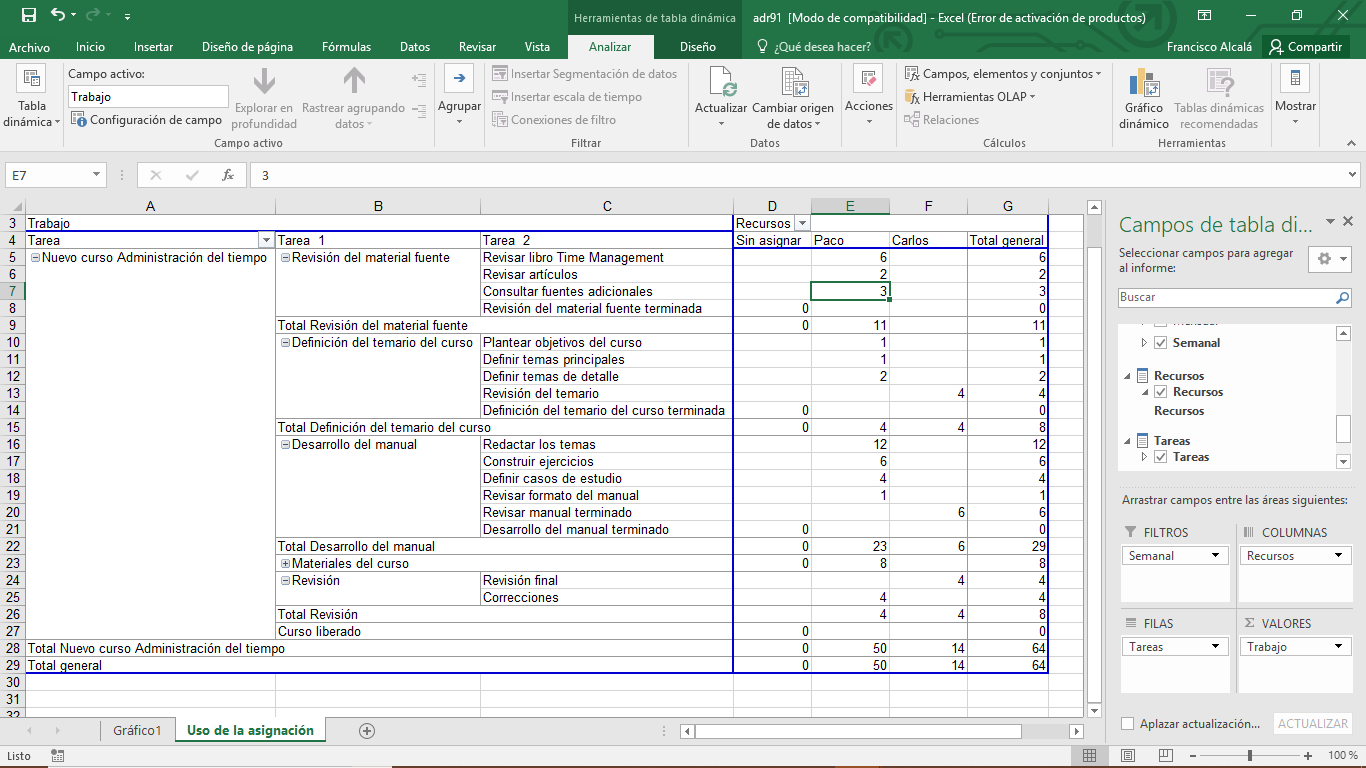
This will create an Excel document with two tabs. First tab will have a bar graph (you can ignore it). Second tab will have a pivot table with resource work data in it. Here you need to add the “Task” field to rows, and the “Resources” field to columns. You could also need to remove the extra work fields (remaining work, baseline work, and so) from the values list, and left the “Work” field only. You'll also need to drill down to the desired sub-task level.
I’m adding an image of the result I got form a small project file (it’s in spanish, but you’ll get it).

Hope this helps. Greetings.
