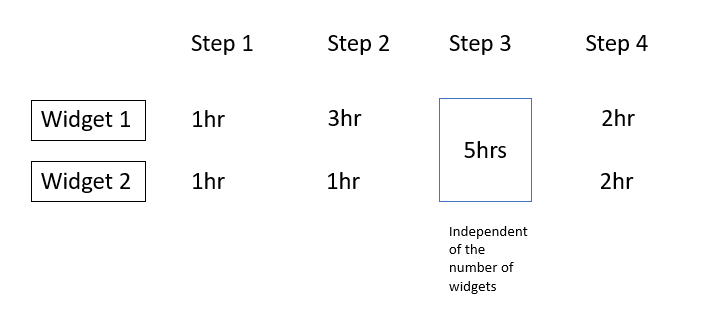
Im trying to estimate cycle time of a process. For example if I am making widgets where each widget type has different process times. However in one of the steps in the process, it is a batch process and therefore is independent of the number of widgets. In such cases how do I calculate the the cycle time for all the widgets without splitting it into batch and non-batch steps?
1 Answer
TL;DR
It really just depends on what information you're trying to communicate. In the end, the kanban is simply yielding data points. It's up to you and your organization to collaboratively determine whether you're visualizing the right data, although I would suggest the current representation lacks queuing time as a visualized data point.
It's up to your organization's working agreements to determine how you will calculate, value, or use the data represented on the board. In other words, what performance indicators, objectives, or key results is this representation meant to measure or convey? How will that data be used to improve the overall process? How will changing the process improve the value stream? Only you and your stakeholders can answer these questions in a meaningful way.
Analysis and Possible Approaches
I'm not 100% sure what you're trying to represent here. If Widget 1 and and Widget 2 are separate swim lanes that share a common column (in this case Step 3) that always takes five hours, that's one way to look at the data: just treat Step 3 as a constant additive value that adds to the overall lead time rather than to each widget's individual cycle time.
On the other hand, if it's a single batch of widgets with a variable number of swim lanes, then you can have an aggregate value for all swim lanes, or represent the cycle time as a range depending on the number of widgets. In that case, Step 3 is a constant additive value for the cycle time of the entire batch of widgets.
In other words, you might do one or more of the following:
- Aggregate your two swim lanes with a total cycle time of 15 hours, assuming you never have more than two swim lanes and that they're relatively steady-state.
- You calculate Widget 1 as 6 hours and Widget 2 as 4 hours, plus any additional widgets you might have. Then add 5 hours for Step 3. That yields your total cycle time for all widgets, assuming you are treating the entire board as a single cycle. With only two widgets, it's still 15 hours, but the details are a little conceptually different.
- You add wait queues between steps 2 and 3 to all swim lanes to represent the average or aggregate hold time until Step 3, since that 5 hours in "Step 3" is a constant time value. You can then estimate the average or aggregate lead time for what we'll call Step 2.5 for our immediate purposes, and add that to your cycle time.
- If each column varies except for Step 3, then you can estimate your mean cycle time excluding Step 3, then add 5 hours to the cycle time for each swim lane. That will allow you to calculate your cycle times for each lane as a range of cycle times or to calculate the statistical mean. For example:
- Widget 1 has a current cycle time of 11 hours.
- Widget 2 has a current cycle time of 9 hours.
- Your average cycle time for these two widgets is 10 hours.
- Your range is 9-11 hours of cycle time for the represented widgets.
In the end, it doesn't really mater how you calculate or communicate your information so long as it's useful and meaningful within your organization's process. Ultimately, it should feed your continuous integration process, or help the company determine if working agreements are being met. So long as everyone agrees on what the data means and how to use it constructively, the actual data itself is simply a means to an end. With that in mind, how you calculate the cycle time simply needs to accurately reflect your process flows, help identify potential bottlenecks, and provide input to the kaizen process.
